
Using LiveArm and DVS X-Ray to Guide High-Intensity Throwing
Last fall, I began preparing my arm to throw at a high level again for the upcoming 2026 USPBL season.
For some, it may seem unusual that the Executive Director of Baseball would be throwing bullpens alongside the pitchers. But there’s a reason for it.
If we expect players to trust the information we provide about pitching mechanics, workload, and performance, they need to see how that information translates into a real throwing program.
Show is better than tell.
That’s why I’ve used this offseason as an opportunity to demonstrate how objective strength testing and biomechanical analysis can guide a pitcher’s progression back to high-intensity throwing.
Two tools have played a major role in that process:
LiveArm and DVS X-Ray.
Together, they allow me to monitor both shoulder strength and mechanical efficiency as my throwing workload increases.
Establishing a Strength Baseline with LiveArm
My throwing progression officially began on October 3rd, 2025, with a slow rebuild of workload and intensity.
But the foundation for that progression actually started months earlier.
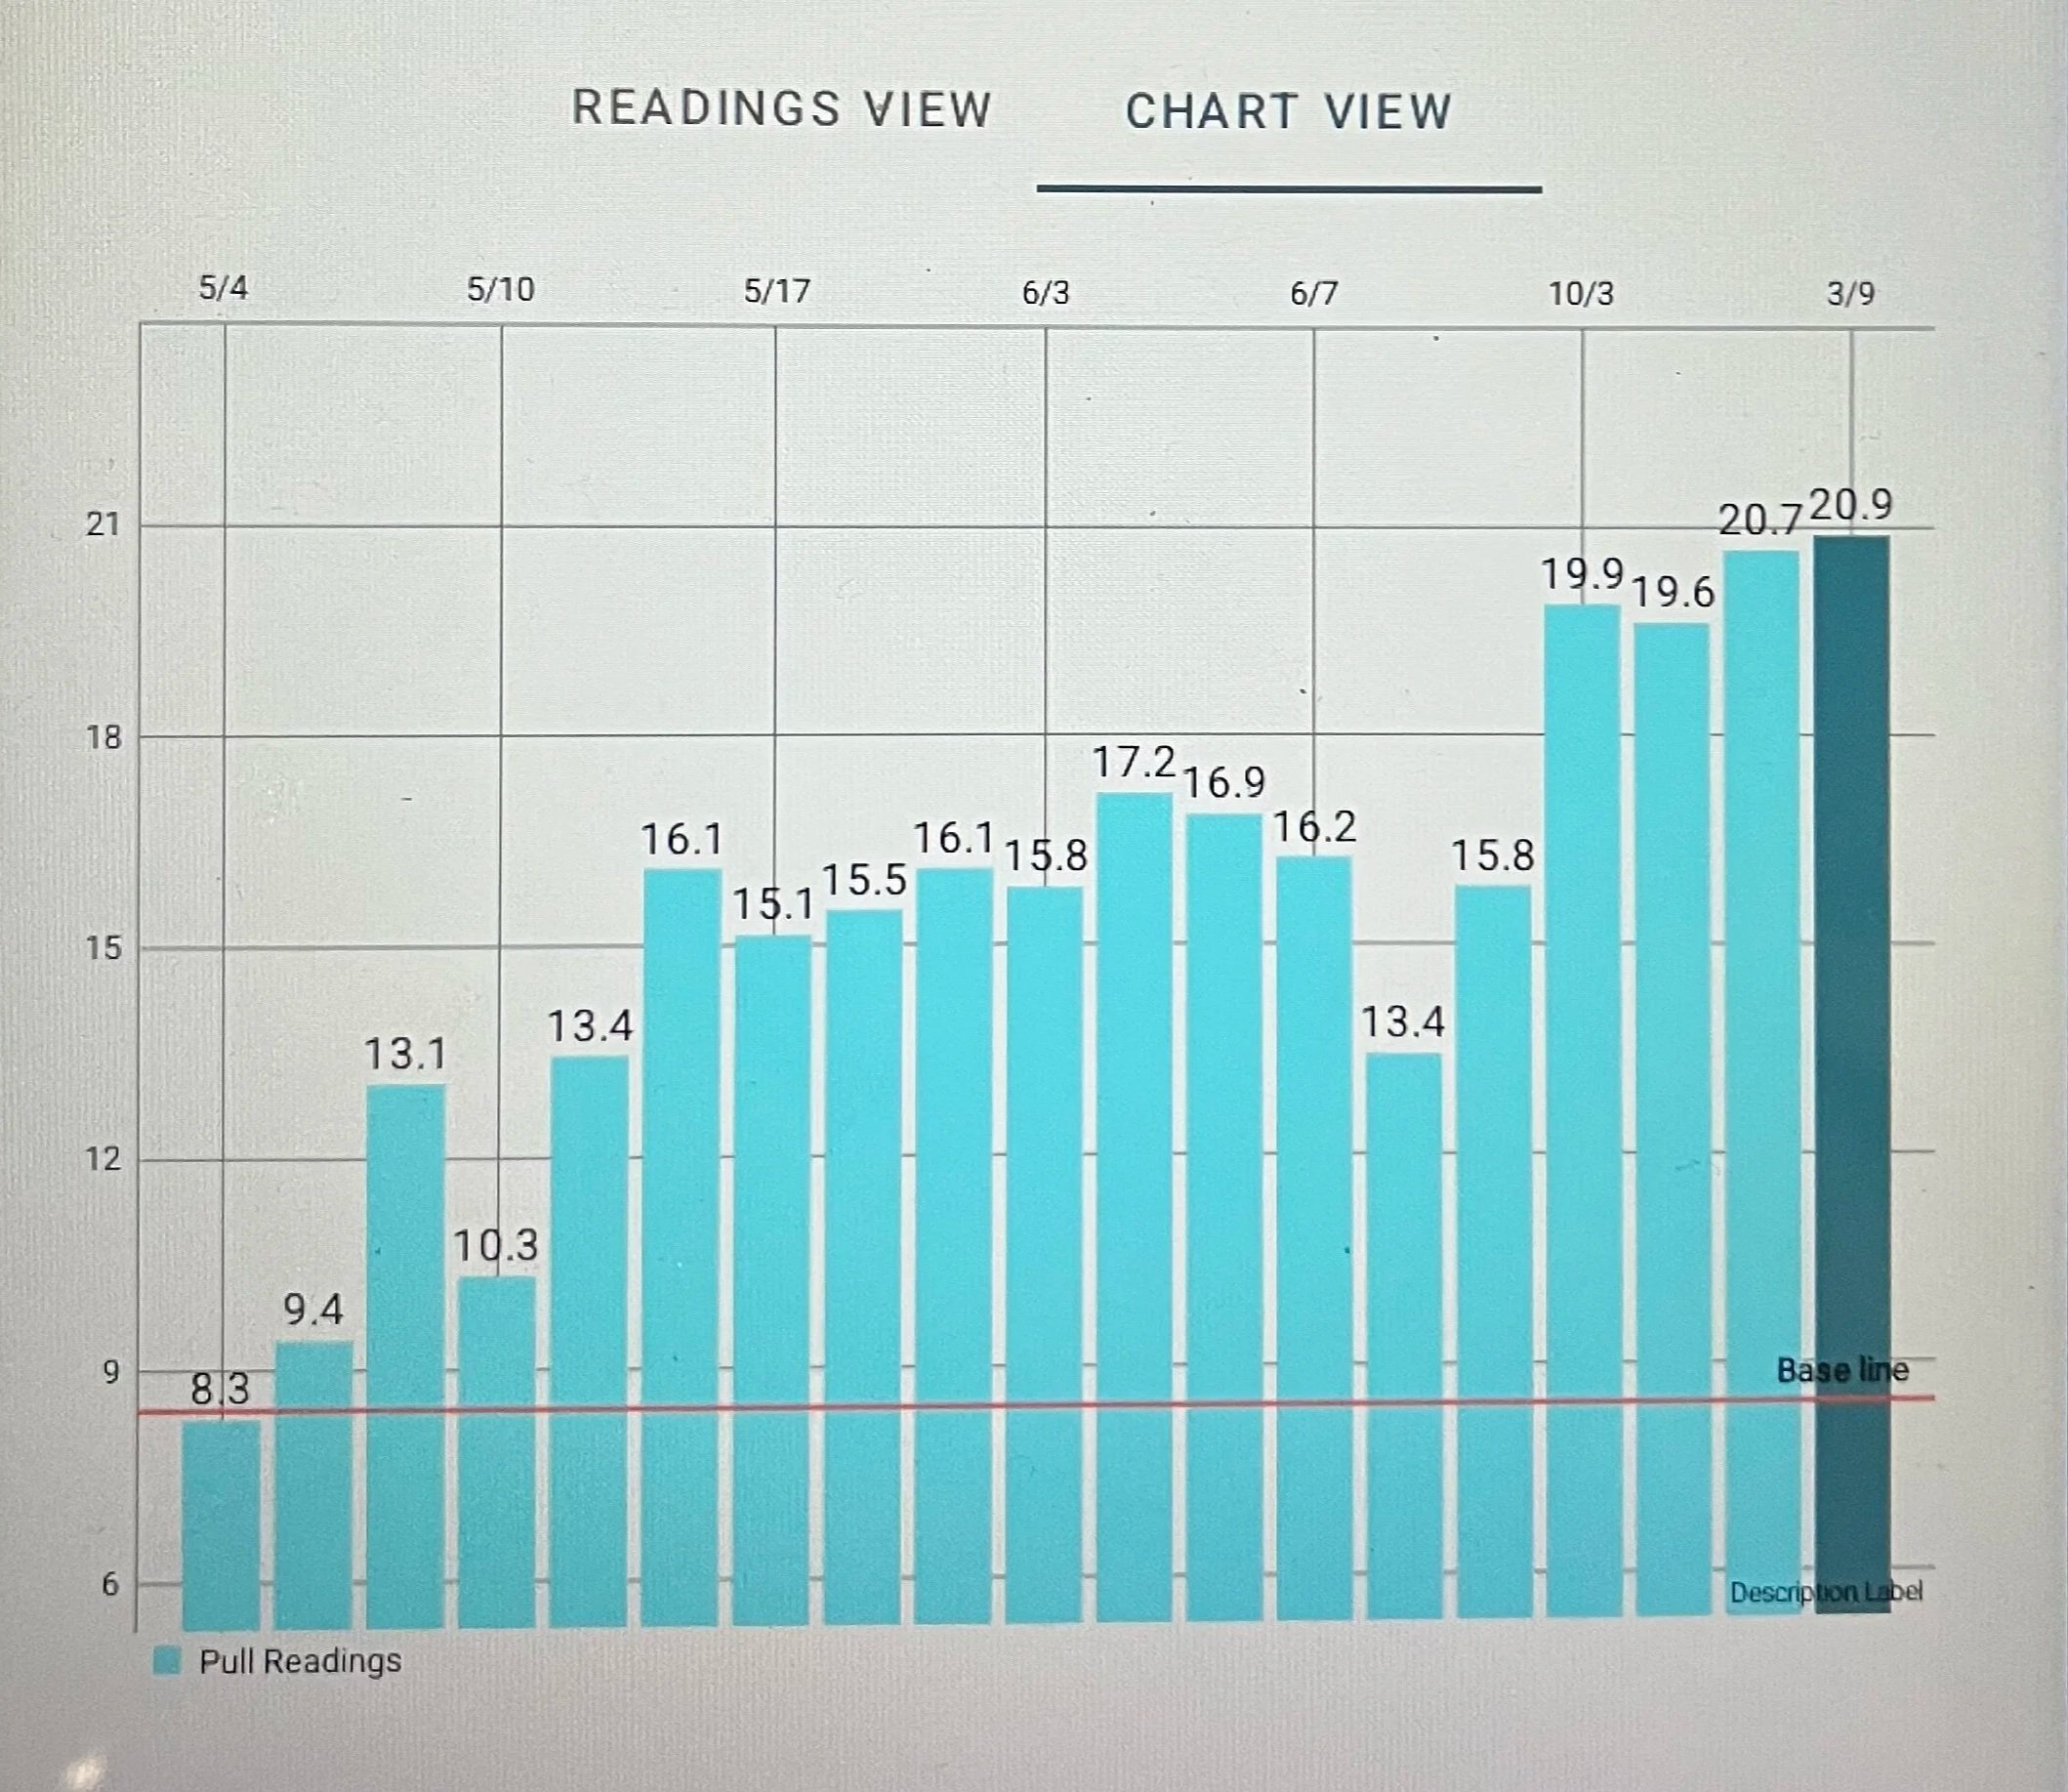
LiVE ARM readings from May 2025 to March 2026
In early May of 2025, I began tracking my shoulder strength using LiveArm while rehabbing from a frozen shoulder. Establishing an objective baseline of strength became an important reference point for every step of my throwing progression.
LiveArm measures shoulder strength through a pull test that produces a numeric reading reflecting the force your shoulder can generate.
Over time, those readings create a reliable baseline that helps determine whether the shoulder is prepared for increased throwing intensity.
Since October, my LiveArm pull readings have consistently stabilized between 20 and 22, even as my throwing workload has increased.
On the morning of March 9th, my readings were:
21.8
22.04
20.7
Because those numbers remained stable, I felt confident increasing my bullpen intensity to roughly 75 percent effort across 30 pitches.
Without that objective reference point, it would be much harder to determine whether my shoulder was ready for that increase in workload.
Using DVS X-Ray to Monitor Mechanical Efficiency
While LiveArm provides insight into shoulder strength, DVS X-Ray allows me to monitor how efficiently my mechanics are transferring energy into the baseball.
Rather than focusing strictly on radar gun readings, I’m looking at how my delivery behaves as my throwing intent increases.
The most important metrics I’m tracking are:
DVS Score, which reflects overall mechanical efficiency and injury risk
Arm Impulse, which measures how acceleration builds through the throwing arm
Acceleration Smoothness, which evaluates how steadily the arm accelerates during release
The comparison video accompanying this article shows my delivery from October 3rd and March 9th.
As my throwing intensity increased, my DVS Score remained stable (19 → 18), indicating that the efficiency of my mechanics remained intact.
At the same time, my Arm Impulse metrics increased significantly, showing that my body is transferring energy into the baseball more effectively as intensity increases.
That’s exactly what we want to see during a throwing progression.
Why Arm Impulse Matters
Arm Impulse measures how much acceleration the throwing arm produces and how long that acceleration is sustained during the final phase of the delivery.
Instead of focusing solely on peak speed, it evaluates the quality of the acceleration pattern. The two pictures below indicate how Arm Impulse Data changes as intensity scales.
Arm Impulse Data From October 3rd, 2025 - 50% intensity
Arm Impulse Data From March 9th, 2025 - 85% Intensity
Higher impulse values generally indicate that velocity is being built gradually through sequencing and energy transfer across the body. Lower impulse values often reflect a shorter, more abrupt burst of acceleration, which can place greater stress directly on the arm.
By monitoring Arm Impulse alongside Acceleration Smoothness, I can determine whether increased throwing intent is being supported by the body or forced late through the arm.
For a pitcher increasing intensity, that distinction is critical.
Connecting Strength, Mechanics, and Workload
When pitchers increase throwing intensity, three factors must stay aligned:
Strength / Function
Mechanics
Workload / Tolerability
LiveArm helps me monitor strength.
DVS X-Ray helps me monitor mechanics.
The throwing program manages workload.
If strength readings remain stable and mechanical efficiency stays intact as intensity increases, the progression is moving in the right direction.
If either of those factors begins to change, adjustments can be made before problems develop.
Applying This Approach Across the USPBL
This season, we will be studying these patterns across all pitchers in the USPBL.
By combining objective strength data from LiveArm with biomechanical analysis from DVS X-Ray, we can better understand how pitchers tolerate workload throughout three critical phases:
the offseason
preseason ramp-up
the competitive season
Our goal is to provide meaningful insight into how pitchers can maintain performance while reducing unnecessary stress on the arm.
Final Thoughts
Throwing harder again isn’t just about effort. It’s about understanding how the body responds to increased workload. Using tools like LiveArm and DVS X-Ray allows pitchers to connect what they feel with what the data actually shows. For me, that information has guided every step of my progression back to higher-intensity throwing. And it’s the same process we’re now applying to pitchers throughout the USPBL during the 2026 season.