
What 4,500 Youth Pitchers Reveal About Injury Risk Mechanics
In the last six months, we’ve added 4,500 youth pitchers to our DVS X-Ray database.
And we continue to see the same pattern: from the Little League World Series, to the College World Series, to MLB’s top drafted pitchers, to MLB pitchers, the distribution of DVS Scores stays remarkably similar.
DVS Score Distributions
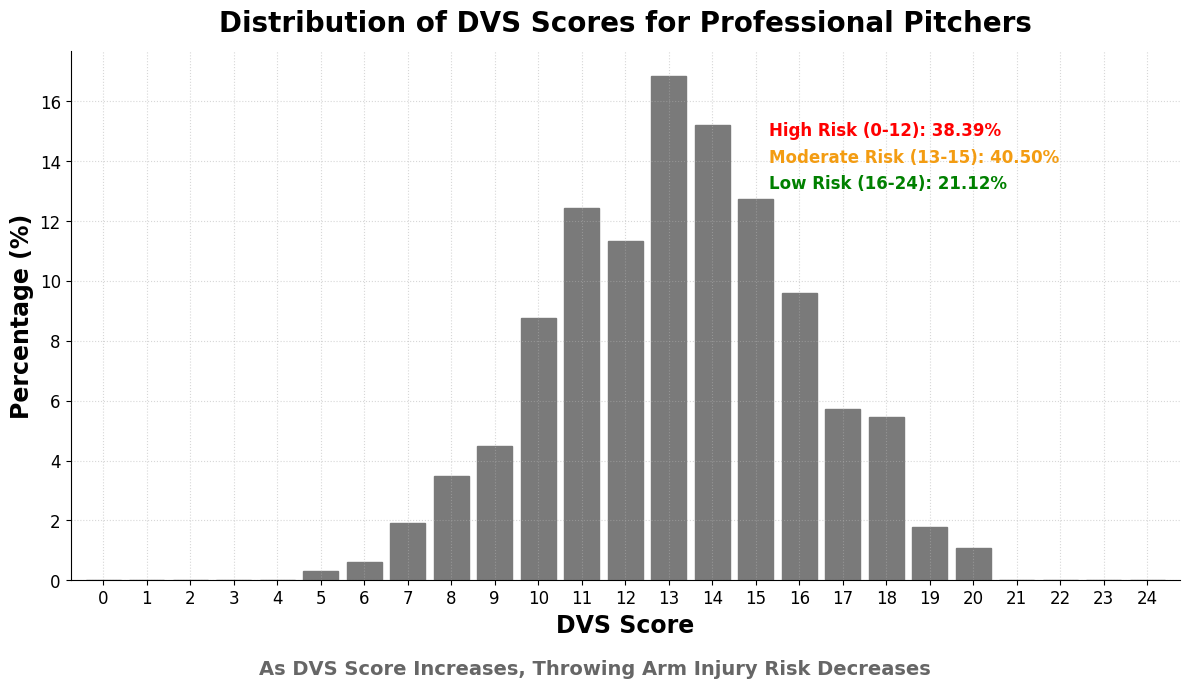
The average DVS Score for MLB Pitchers is 13.1
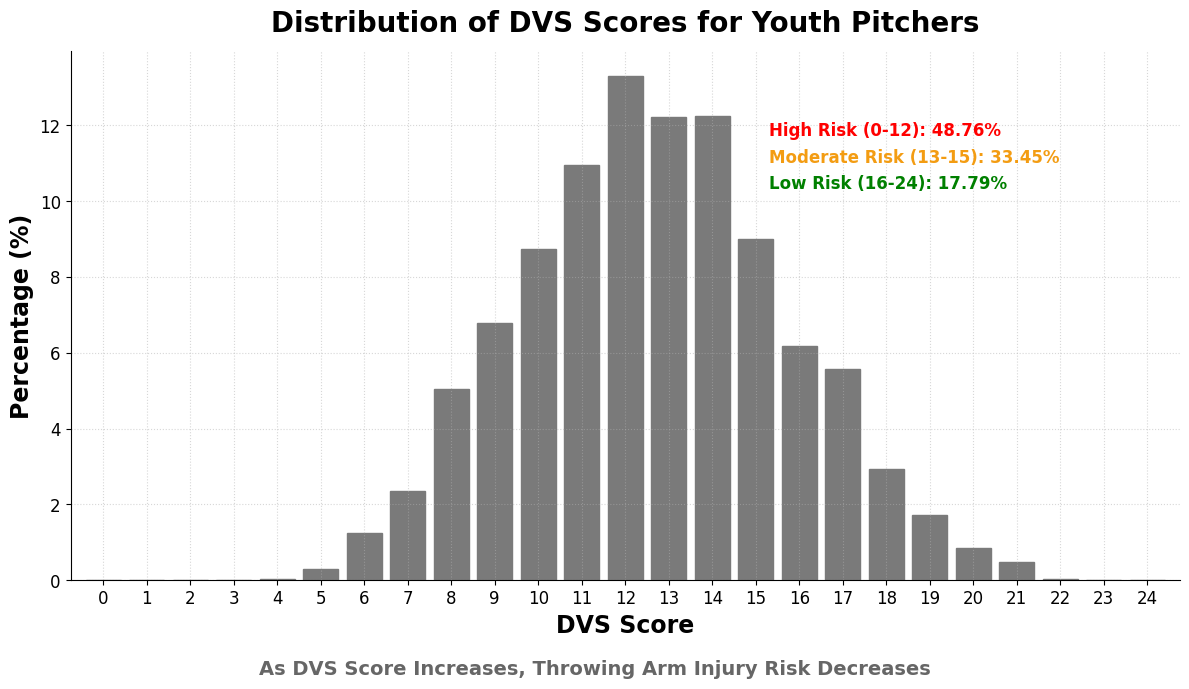
The average DVS Score for the last 4500 youth pitchers is 12.67
Whether you agree or disagree with the basis and value of our Delivery Value System, or prefer a different biomechanics model, one truth keeps holding up:
How a pitcher moves matters.
You can call it mechanics, the delivery, sequencing, movement quality—whatever terminology you like. A pitch can’t happen without movement, and movement shapes the forces a pitcher has to manage.
And as velocity climbs, the margin for error gets smaller. The harder you throw, the more important it becomes that your body is creating force with the right blend of mass, leverage, and energy—not just effort.
Quantifying Mechanics
That’s the point of quantifying mechanics. Not to turn pitchers into robots. Not to erase individuality.
It’s to standardize how we evaluate the delivery and how we teach the foundation—so athletes and coaches have a shared language, and a pitcher can understand what he’s doing quickly without needing a biomechanics degree.
You can be individualistic. You can advocate for motor preferences. You can say “every pitcher is different.”
All true.
But when you look at population patterns, the distribution isn’t random. In our dataset, roughly 45% of pitchers fall at a total DVS Score of 12 or below—the portion of the population our model flags as higher risk mechanics.
That doesn’t mean injury is inevitable.
It does mean that if a pitcher at 12 or below keeps pushing strength, velocity, and volume without improving how he’s creating and transferring force, the risk profile tends to compound.
We’ve also seen this relationship hold at the highest level. We have 3,000+ former and active MLB pitchers in our injury risk model. In our model, MLB pitchers with a DVS Score of 16 or higher throw more innings before a major arm injury event and carry less pitch-to-pitch arm injury risk than lower-scoring peers.
By major arm injury, we mean missing 90 days or more.
Even if you don’t “teach mechanics,” almost everything in training still teaches mechanics. Throwing programs, weighted balls, plyo drills into a wall, they all reinforce a movement pattern. They train a foundation, whether you label it that way or not.
The best outcomes for players are when the industry gets more aligned, more measurable, and more collaborative.
DVS Score 12 vs. 16 (Low Risk vs. High Risk)
Here’s what the average pitcher’s component profile looks like in our current dataset:
Mass and Momentum (MM) = 1.46
Arm Swing (AS) = 2.03
Posture (P) = 2.03
Position at Foot Strike (PAFS) = 1.63
Path of Arm Acceleration (PAA) = 1.06
Finish (F) = 1.09
Avg Total DVS Score = 12.6
Avg Total MLB Score = 14.1
In simple terms: risk changes meaningfully as pitchers move into higher DVS Score territory, and the biggest levers we see most often are MM, PAFS, and AS.
The first video shows what a typical DVS Score of 12 looks like.
The second video shows what a DVS Score of 17 looks like.
There are 15,000 unique combinations that can produce a total DVS Score—and about 2,400 of those fit a low-risk mechanics profile. We’ve watched these storylines play out for years, and now—with a growing network of DVS Trainers—we’re able to have better conversations in more communities.
We’ll keep highlighting the transformations, but the clearest proof is still the same:
Let the players tell the story. Real voices. Real outcomes.