
Improve Your DVS Score: The 4-Phase Blueprint for Healthy Velocity
Transform Your Career in 6 Months
One of the simplest ways to understand the value of a DVS Score is to look at what happens when a pitcher commits to improving it.
A professional pitcher in our program went from being released to earning a new opportunity in less than six months by improving the efficiency of his delivery and training strategy:
DVS Score: +3 points
Average FB Velo: +2.4 mph (91 → 93.4)
Max FB Velo: +4 mph (94 → 98)
Strike %: increased
Injury Risk: significantly reduced
He didn’t “find a new arm.” He improved the efficiency of how his body transferred energy into the baseball and built training habits that supported it.
This video showcases a remarkable transformation that illustrates what’s possible when a pitcher prioritizes mechanical efficiency over maximum effort.
After being released by the Seattle Mariners in March 2016, this pitcher spent the next six months focused on a complete overhaul of his delivery and training strategy. By the time he signed with the Cincinnati Reds in October 2016, his performance metrics had undergone a massive shift.
Why Improving Your DVS Score Works
Great performers don’t just work harder—they understand their craft. Pitching is no different. Every pitcher has a “toolbox,” and the most successful arms learn how to use it efficiently.
Mechanical Efficiency has one of the biggest impacts on both performance and durability. That’s why the DVS Score exists—to measure how efficiently a pitcher is moving and transferring energy through the delivery.
Without that awareness, you’re essentially training blind in a baseball culture that constantly rewards velocity, even when the body can’t sustain it.
And when you compare DVS Score averages across populations (youth and pro), the reality is: most pitchers are leaving efficiency and durability on the table. So the purpose of this article is simple. Once you receive a DVS Score, here is the clearest, most effective way to improve it.
To do that, we’ll use the four phases of the pitching delivery and explain what actually changes when a pitcher becomes more efficient.
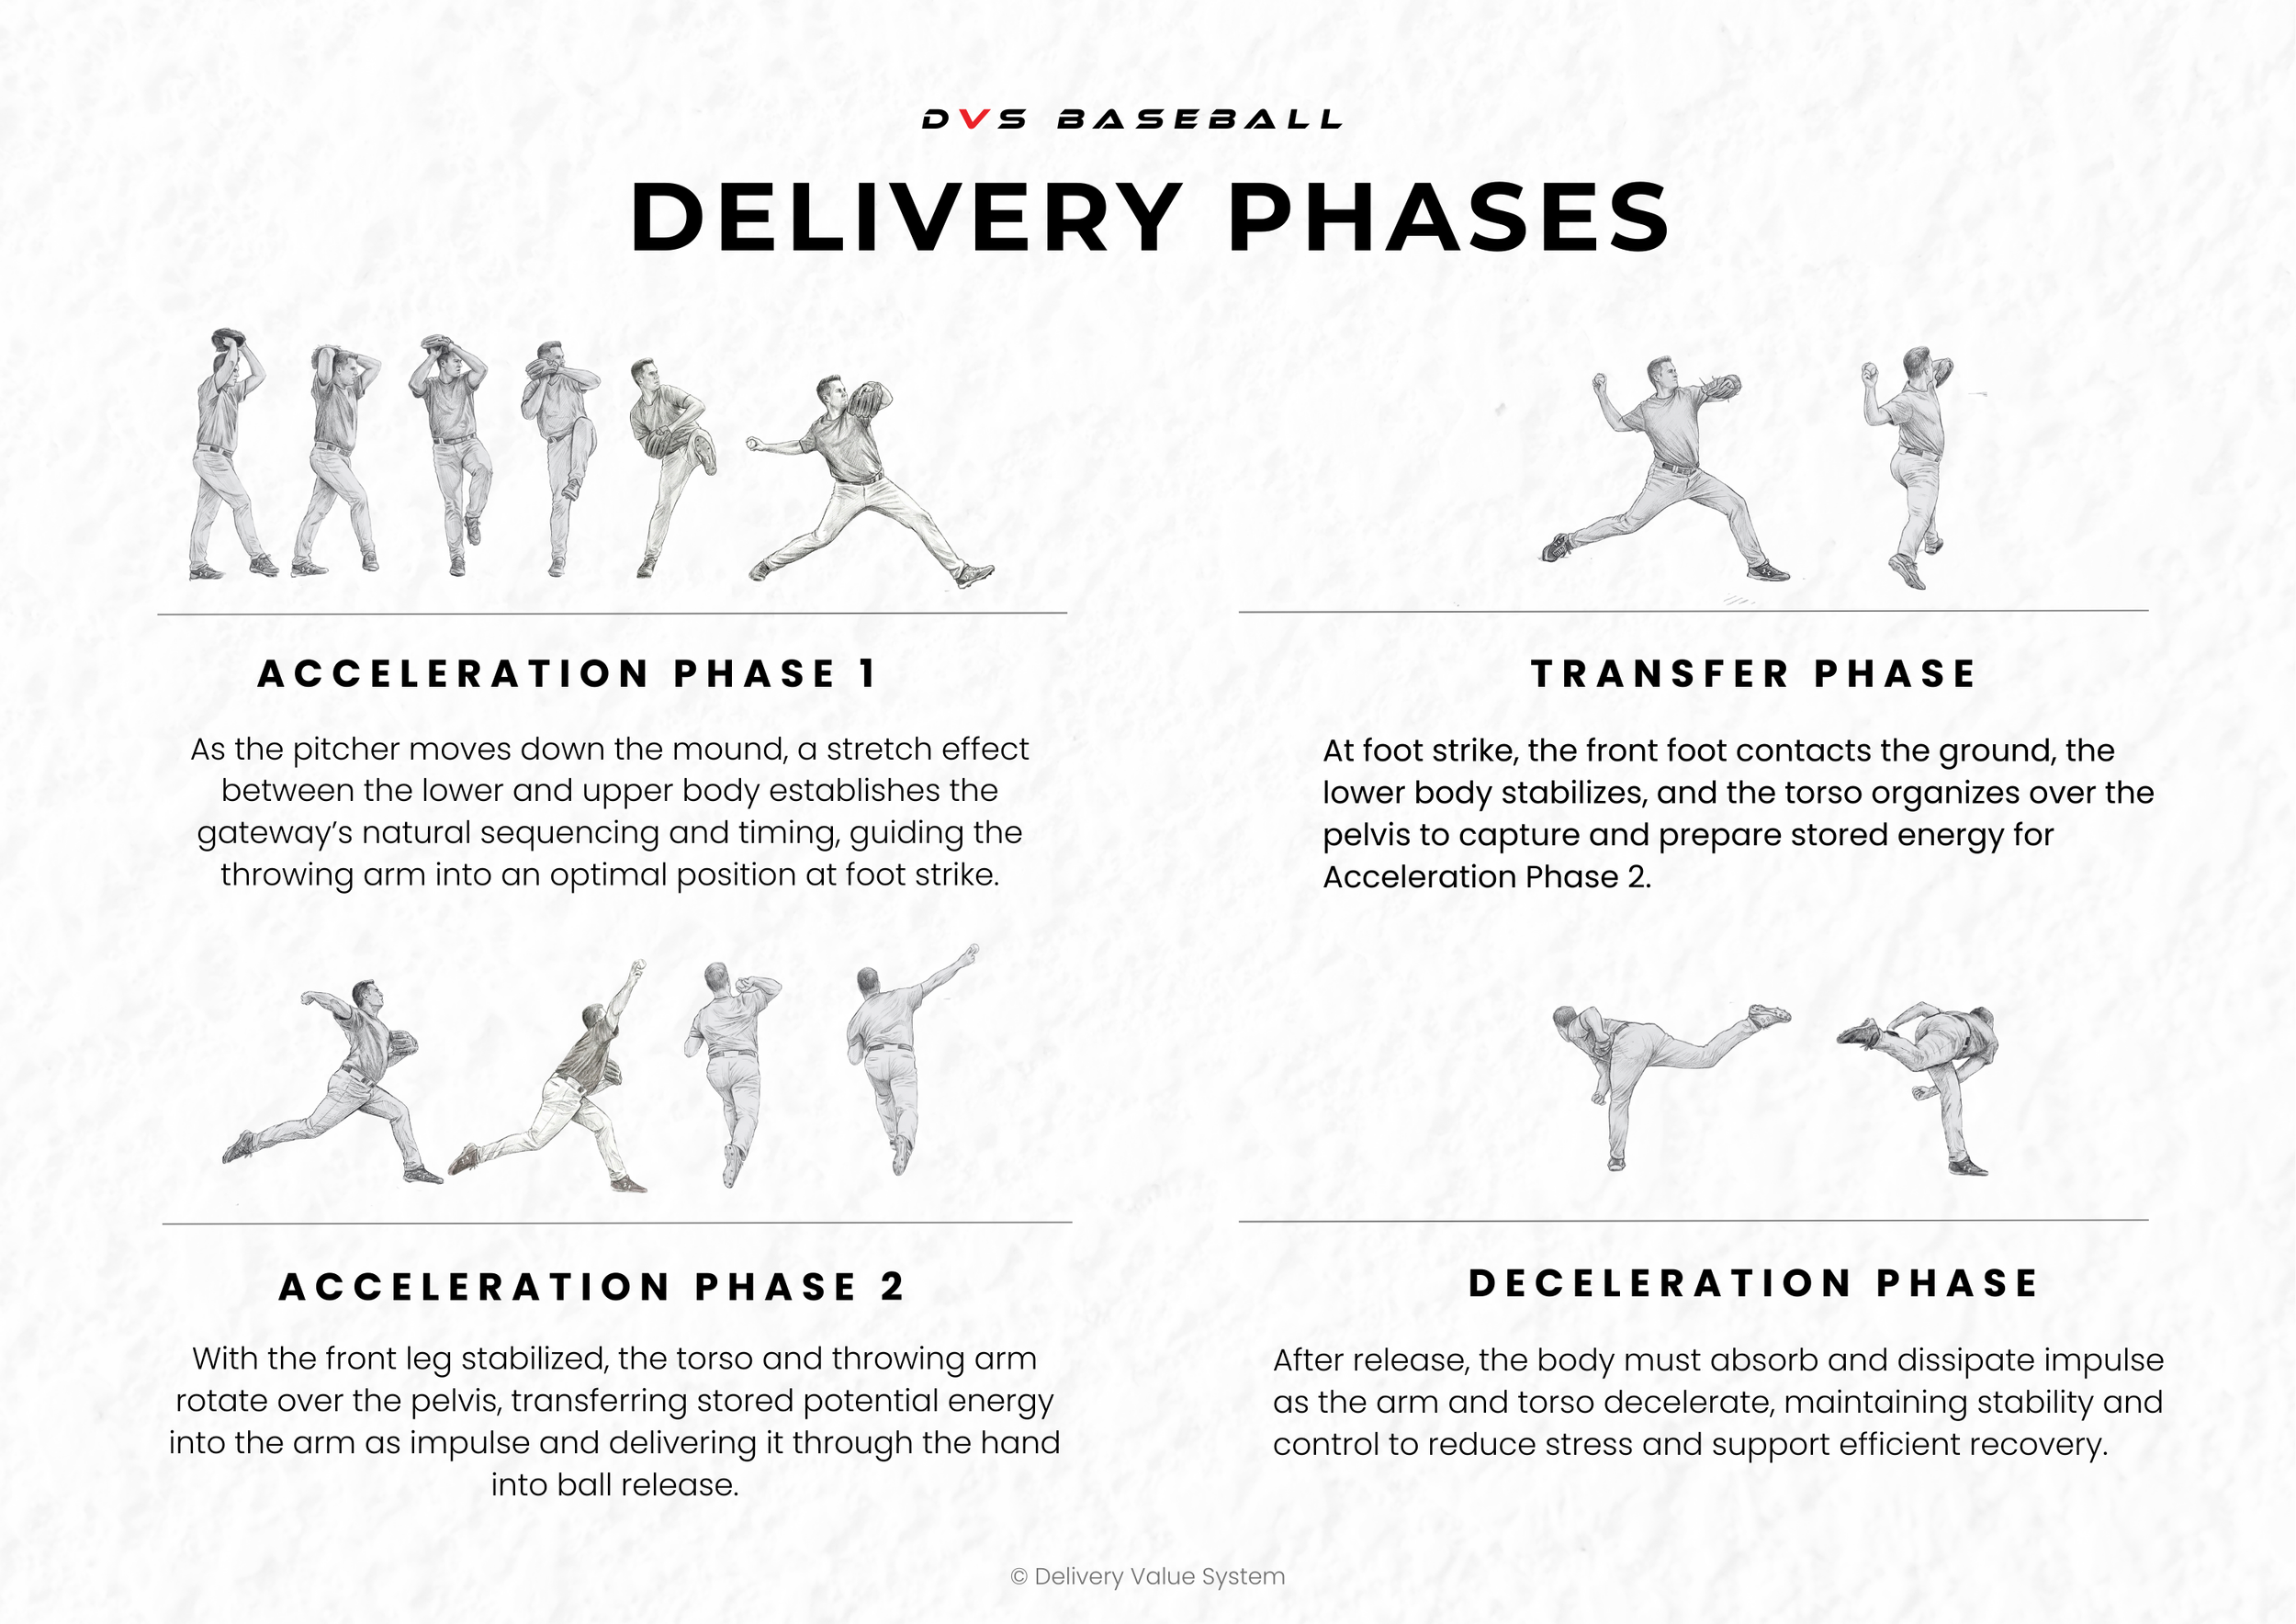
The 4 Phases of the Delivery (and What to Improve)
1) Acceleration Phase 1: Build Early Energy
Let’s start with the first phase of the pitching delivery, Acceleration Phase I. This phase embodies three of the six categorical scoring components used to calculate a DVS Score, and essentially relates to how well a pitcher is developing initial energy that can be transferred throughout the remaining delivery. If initial energy is good and efficient, leverage and timing will also have the opportunity to be good. On the contrary, if this energy-building process is poor and inefficient, leverage and timing will likely suffer. To understand this better, let’s take a look at a pitcher that takes full advantage of Acceleration Phase I, and one that does not, in the videos below.
What efficient pitchers do here:

Acceleration Phase 1: Efficient Example
First off, notice how well this pitcher initiates energy within his lower half. This is evident by the amount and direction of movement that takes place in his back leg and pelvis, which falls within the Mass & Momentum category of the delivery. However, it's not just about the amount of movement that occurs, but the quality of movement as well. This may be tough to see, but if you look close you will notice how his back leg never really stops moving towards the plate; his energy and momentum remain constant through the ground. Also, watch how his back leg essentially moves at the same speed as he progresses down the mound.
We touch on this more when we break down Acceleration Phase II, but because he gets his body moving quickly and early, he never really has to make up significant ground later, which allows for a smooth and efficient transfer of energy. Combine this with an efficient Arm Swing path and good Posture within the trunk, not only does this individual have a greater opportunity for energy transfer, but he is able to attain stronger, more supported positions throughout the subsequent phases of his delivery.
What inefficient pitchers do here:

Acceleration Phase 1: Inefficient Example
Contrary to the previous video, notice the pitcher above does not initiate near the amount of movement within his back leg and pelvis prior to committing to home plate. As a result, this is going to force him to "catch-up" in order to compensate for lost energy. You can see his attempt to do this by focusing in on his back leg. Unlike the previous pitcher that maintained a constant speed within his lower body, this individual starts slow, but the moment before his lead foot hits the ground he begins to accelerate through his back leg. This often creates the sensation or appearance of "lunging" or "jumping" off the mound. Ultimately, this pattern will not only limit the amount of energy transferred up the chain, but it's going to do so in a manner that places much greater stress on the throwing arm.
2) Transfer Phase: Leverage + Strength at Foot Strike
The next phase of the pitching delivery is the Transfer Phase. In sum, this phase serves as the transition point between Acceleration Phases 1 and 2, and is highly related to leverage, timing, and stress. Essentially, this is the product of the work done in Acceleration Phase 1. If the work is done well, the Transfer phase will likely be good; if not, then not so much. Regardless, a pitcher must still have the strength to support their body weight and momentum to ensure that no energy is lost in the transfer. To break this down further, let’s continue with the same pitchers from above; however, this time we will be analyzing Position at Foot Strike, which is the only categorical scoring component within this phase. Once again, the pitcher on top is a product of efficiency, and the other is not.
This phase is heavily tied to:
Leverage
Timing
Stress
The Stretch Angle (Separation)
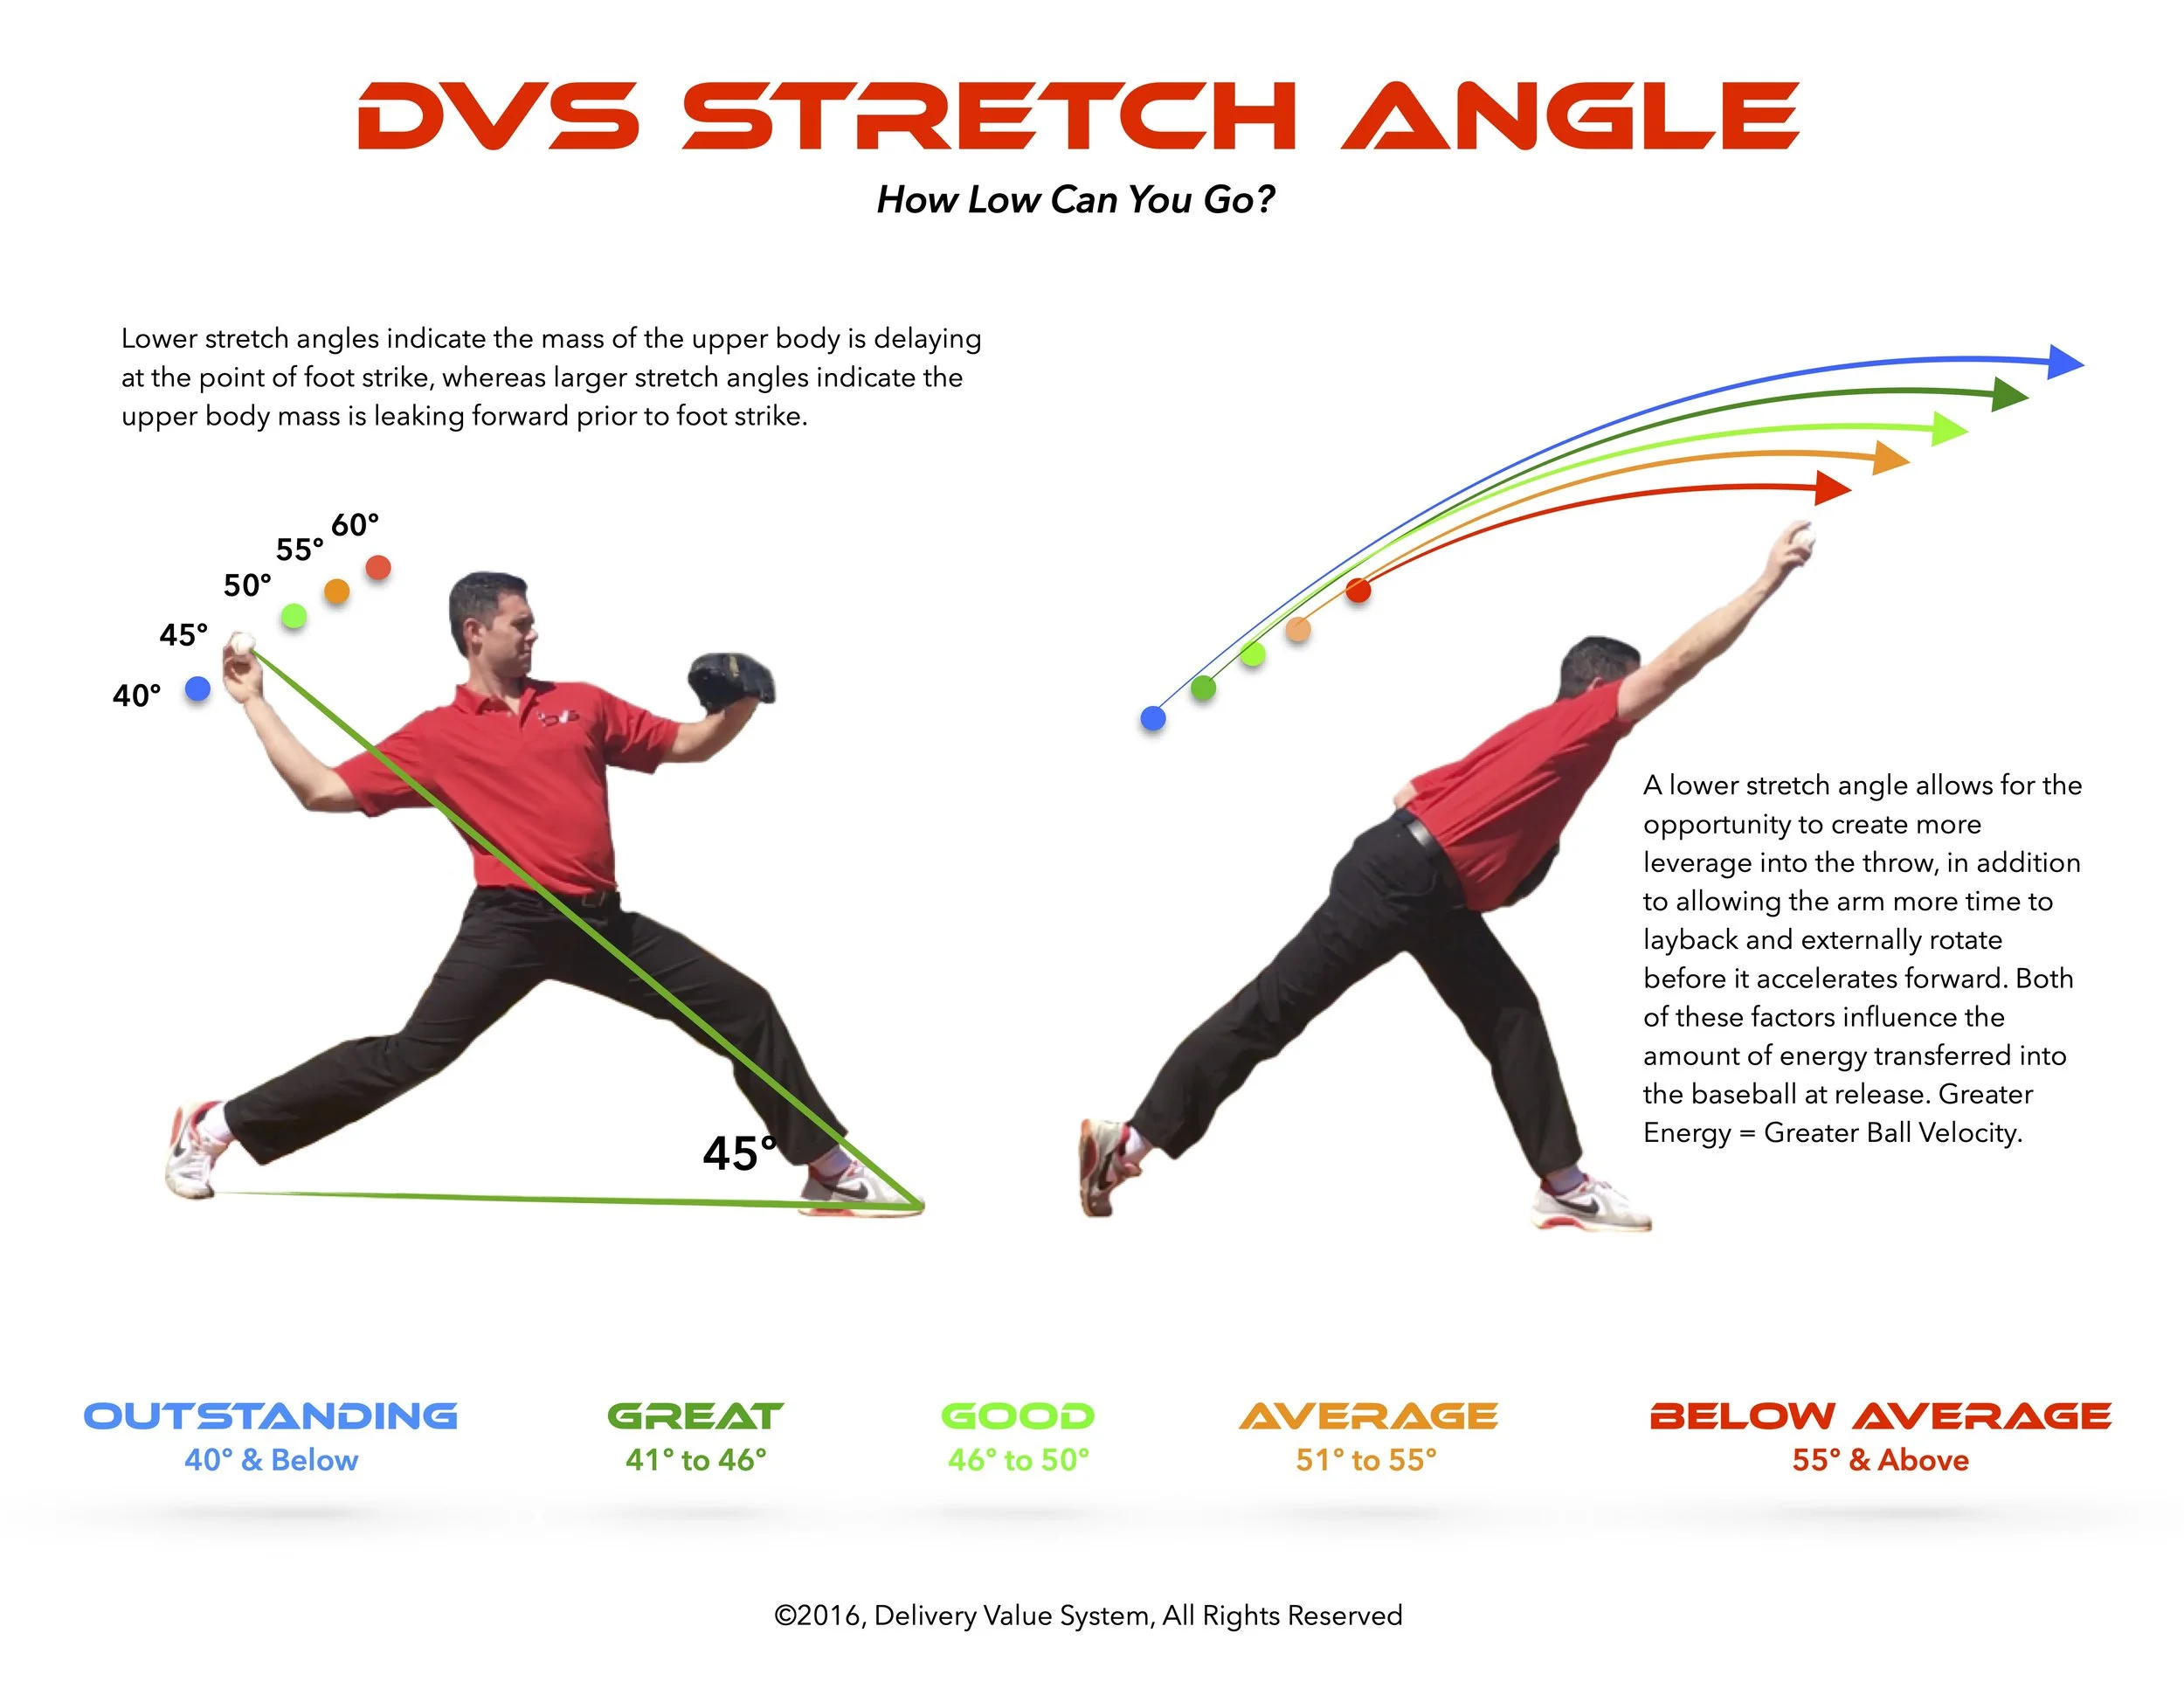
Although the time-window we're analyzing in this phase is relatively short, there are still a few major things we can take note of. The first and primary point of emphasis is what we call the Stretch Angle. Essentially, this accounts for the degree of separation between the lower body and upper body at the moment of transfer, and is commonly what we're referring to when discussing "leverage." Let's take the first video below, and without getting into too much detail, hone in on the point at which his lead foot plants firmly into the ground. Even though his hips are opening towards home plate, notice how the logo on his chest remains squarely towards third base. By allowing his upper body to remain "back" as his lower body opens, he is able to create greater separation and increase the amount of leverage generated into the throw. This also allows his arm to be more supported by his trunk and back musculature, which is going to help dissipate stress throughout acceleration.
Efficient example:

Transfer Phase: Efficient Example
Hips begin opening
Chest stays back longer (upper body doesn’t leak forward)
More separation → more leverage → better trunk support for the arm
Inefficient example:

Transfer Phase: Inefficient Example
Upper body leaks toward the plate early. Higher Stretch Angle.
Less separation → less leverage → less support → more relative arm stress
Leverage is only useful if you can support it
Now let's take the same time-window using the pitcher above. Upon Foot Strike, notice how this individual's upper body begins to "leak" towards home plate as his hips open. This essentially reduces the amount of separation and leverage generated into the throw, and limits the support provided by the larger muscles of the body. The overall effect? This pitcher has a reduced ability to create velocity, and his arm will endure greater amounts of relative stress throughout the remaining phases of the delivery.
Ultimately, efficiency within the Transfer Phase boils down to leverage and strength. Not only do you need to be able to generate mechanical leverage through separation, but you also need to be strong enough to support it so it can be fully utilized. To make this concept easier to digest, let's compare it to something else in which success is based on these same principles as Pole Vaulting.
Pole Vaulting - Utilizing Leverage and Strength
In the first video, notice how much more leverage the pole vaulter generates, which is evident by not only the bend in the bar, but how far his body is away from the bar as well. This would obviously be synonymous with a pitcher that exhibits a very good stretch angle. Not only that, but you can also see how well this individual is able to control and stabilize the pole as he prepares to launch, which will directly impact his projection.

Example of a pole vaulter that displays good leverage and strength within his technique
On the contrary, let's look at the pole vaulter in the second video. Not only does he fail to create near the amount of bend in the pole, but there is hardly any distance between his body and the pole itself. Overall, this individual exhibits much less mechanical leverage and strength in his technique, which diminishes his power and speed as he launches off the pole.
3) Acceleration Phase 2: Timing Wins (or Stress Wins)
Following the Transfer Phase, the delivery now enters Acceleration Phase 2, which is also highly dependent on the work executed in the previous phases. Essentially, this is where a pitcher either continues to ride the momentum and energy generated from Acceleration Phase 1, or they have to make up some ground in order to get their arm up to speed. This is now reflected inside DVS X-Ray as Arm Impulse.
Take two cars, for example, at the start of a drag race. The first car is allowed to approach the starting line at a speed close to its top-end speed, but the second car is forced to accelerate from a dead-stop. Not only is the first car probably going to reach a higher top speed in a shorter amount of time, but it’s going to do so with much less torque and violence. Therefore, a pitcher that is efficient in their delivery up to this point has the potential to reach greater arm speeds with much less turbulence on the throwing arm. The opposite is true for a pitcher that is relatively inefficient. Not only will inefficiency limit maximum arm speed, but it's going to place enormous amounts of torque and stress on the arm due to a shorter acceleration window.

Like a car accelerating from a dead-stop, a pitcher that fails to initiate early energy in their delivery will have to make up for it later, leading to poor timing and added torque/stress on the throwing arm.

Acceleration Phase 2: Efficient Example
The pitcher above is an example of a pitcher that "approached the starting line at higher speeds. Because he was efficient in Acceleration Phase 1, he was able to create sufficient energy by means of his lower body, and then seamlessly transfer that energy up the chain to his trunk and arm. This is often the concept being referred to when a pitcher is said to have "good timing." Because his arm never really has to "make up ground" and compensate for lost energy, his arm rotates in-sequence with his trunk, which not only optimizes the transfer of energy but also reduces the amount of stress placed on the throwing arm. Furthermore, in light of the early acceleration path, his arm is given the opportunity to lie back early and completely, which is commonly evident by the arm lying back closer to the midline of the body.

Acceleration Phase 2: Inefficient Example
Unlike the previous pitcher, the individual above is more indicative of the car that accelerated from a dead stop. Because he never really generated sufficient energy early with his lower body, he had limited energy available for transfer. As a result, he is forced to "catch up," which causes him to accelerate much later in relation to the previous pitcher. This causes various problems, but the main issue is something known as Hyperangulation. This occurs when the trunk and arm become out-of-sequence, and essentially, the trunk starts to pull away from the arm. This is evident in the first few seconds of this video, at the moment when the letters on his jersey begin to turn towards home plate.
Pitchers that exemplify Hyperangulation will also typically experience arm-layback much further away from the body's midline; and contrary to the previous pitcher, this pitcher doesn't experience full layback until the ball is nearly outside of his throwing shoulder. Once again, this is largely due to the fact that he probably didn’t think about "hitting the gas" until much later, causing delays and ultimately forcing a rushed acceleration path. The end result? Inefficient energy transfer and increased stress are placed on the throwing arm.
4) Deceleration Phase: Finish = Force Management
This leads us into the final phase of the pitching delivery, the Deceleration Phase. This phase is extremely important as the forces generated upon ball release are greater here than at any other point in the delivery. As such, efficiency within this phase can be quantified by how well a pitcher dissipates those forces throughout their entire body. This is why a pitcher's follow-through is so important, because it elongates the deceleration window and essentially reduces the amount of torque on the arm.
Unfortunately, being able to effectively mitigate the stresses placed on the arm in this phase goes a little deeper than just "following through," as it relies heavily upon efficiency up to this point. Essentially, it all boils down to the timing between the arm and trunk. If efficiency is present, timing will be relatively optimal, and the arm will move seamlessly with the trunk. This reduces turbulence upon ball release and allows those deceleration forces to be better dispersed throughout the larger muscles of the body. However, if a pitcher is relatively inefficient, timing will be less optimal, turbulence will be greater, and the arm will be forced to take the initial burden of energy absorption.
In other words, the arm will endure much greater amounts of stress if efficiency is relatively low. Although this phenomenon can't technically be seen with the naked eye, it can be indirectly inferred based on the positions a pitcher assumes in this phase. Therefore, let's refer to the videos below for further insight.

Deceleration Phase: Efficient Example
The pitcher above is once again used as a representation of efficiency, and as we just stated, the key to an efficient deceleration phase is to effectively dissipate the forces generated upon ball release by elongating the deceleration window. As such, notice how long this pitcher stays within his follow-through. He never "cuts-it-off," and essentially continues to decelerate until his range-of-motion prevents him from going any further. Yes, strength is a key factor in supporting a finish like the one you see here, but equally important is the work done up to this point. If efficient, and energy is generated and transferred appropriately, it's almost natural that the body will carry into a complete finish.

Deceleration Phase: Inefficient Example
The opposite is true for a pitcher that is relatively inefficient. Initially, because the pitcher above accelerated more with his arm rather than his entire body, it's natural that his arm will assume most of the deceleration responsibilities as well. This is evident by the shortened follow-through, and even though his anatomy would probably allow him to get much deeper into this finish, he "cuts it off," thus shortening his deceleration window and increasing the burden on his throwing arm. Once again, although strength is a significant factor in being able to support a quality finish, this is likely not the culprit here. Rather, it was how he thought about developing force into the baseball, which negatively affected his energy transfer and ultimately his finish.
Improve Your DVS Score
Now that we've peeled away some layers, let's get back to the process of improvement and how you can manipulate these concepts to your advantage. Even though that may have seemed like a lot to digest, just remember that it all starts with the mindset of what you're trying to do. Once you grasp that and begin to understand how everything works together, the rest of the pieces just sort of fall in place.
To begin your journey towards success, the first thing you need to get is your DVS Score. This will let you know where you currently stand, and from here, you will be given customized recommendations on a plan going forward.
As a baseball pitcher, success is what you're truly after; in essence, everything you do is geared towards playing at the highest level of competition that your physical capabilities allow, for the longest period of time possible. I think that every pitcher, at every level, in every country, would agree with that. However, what's not always agreed upon is the best way to get there. The current baseball culture in the U.S has been polluted with distractions, most of which that feed off the notion that if you do more, you'll be closer to where you want to be. More throwing, more long toss, more weighted balls, more lifting. Unfortunately, a pitcher's success is much more contingent upon what you do, and not how much you do. Therefore, to reach success, you not only have to have a clear understanding of what your goals are, but a strategy in place that aligns with those goals as well.